The Challenge
The merged UX organization faced a critical knowledge gap. With team assignments based on intuition rather than data, leadership couldn't effectively:
- Identify optimal team compositions for projects
- Understand individual capabilities and growth areas
- Make strategic hiring or training decisions
- Leverage hidden strengths within the team
The Core Problem: We needed to transform superficial skills inventory into actionable team optimization insights that could drive real business decisions.
The Unexpected Foundation: Gaming Analytics
From Overwatch to UX Team Optimization
My expertise with Google Sheets' QUERY function came from an unexpected source: analyzing my own Overwatch gameplay statistics. I had built complex spreadsheets to track damage output, kill ratios, and survival metrics to identify improvement areas in my gaming performance.
Key Skills Transfer:
- Multi-dimensional analysis: Gaming stats (damage/kills/survival) → UX skills (expertise/interest/role fit)
- Performance optimization: Personal gameplay improvement → Team composition optimization
- Pattern recognition: Identifying gameplay weaknesses → Discovering organizational skill gaps
Solution Architecture
Comprehensive Skills Database
I created a centralized data system that captured comprehensive skills assessment across 120 different UX competencies. Each team member rated their expertise level and interest level for every skill, creating a rich multi-dimensional dataset.
Assessment Framework
Expertise Scale: No Experience | Working Knowledge | Mastered
Interest Scale: Interested | Not Interested
Scope: 120 UX skills covering technical, strategic, and domain expertise
SQL-Powered Analysis Views
Using Google Sheets' QUERY function extensively, I built multiple analytical views that could slice and dice the data. Each view provided leadership with accessible interfaces to explore team capabilities:
Individual View
Complete skill profiles for each team member
Skill Analysis
How all teammates ranked across specific skills
Role Definition
Weighted skill matching against role requirements
Service Capability
Team capacity for four core service offerings
Team Comparison
Custom team builder with strength analysis
Project-Specific
Flexible skill matching beyond traditional roles
Strategic Team Optimization Engine
Custom Team Builder: Leadership could slot in any number of teammates and instantly see aggregated skill strengths, capability gaps, role distribution, and service delivery capacity across all 120+ competencies.
Skills Assessment Interface
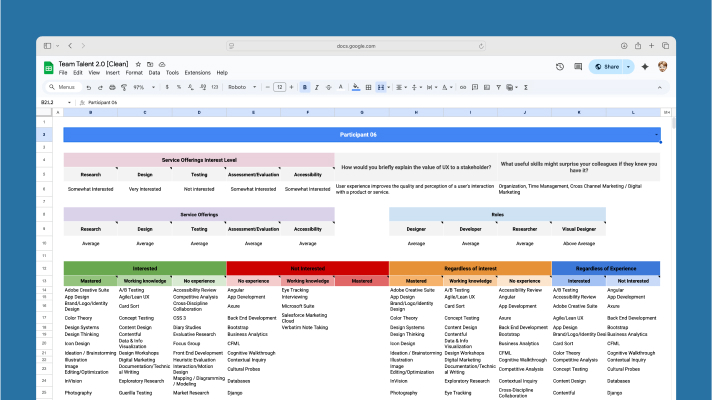
Individual skill assessment with expertise and interest ratings across 120 UX competencies
Team Analysis Dashboard
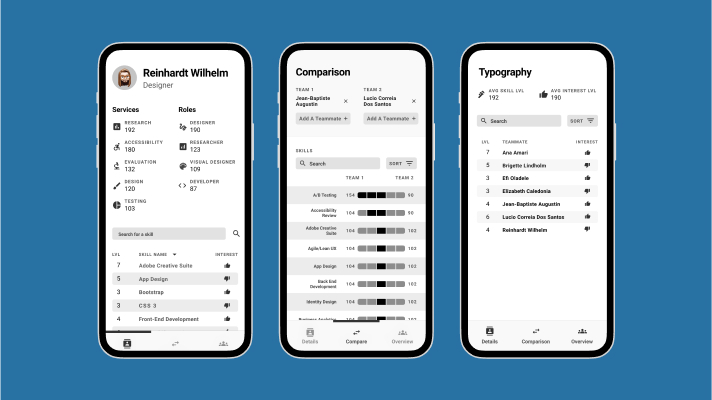
Advanced QUERY-powered analytics providing leadership with team optimization insights
The weighted ranking system automatically scored team members' fit for different contexts. High skill matches received positive weights, while skill gaps were flagged as potential weaknesses, enabling data-driven staffing decisions.
Key Design Decisions
Self-Assessment Challenges & Psychology
The Dunning-Kruger Effect in Practice
Team members with limited expertise often overrated their abilities, while highly skilled individuals who understood the depth of their knowledge gaps rated themselves more conservatively. This created data distortions where true experts appeared less capable than novices on paper.
Calibration Considerations
While I didn't implement peer validation in this version, recognizing these psychological patterns informed how leadership interpreted the results and highlighted the need for managerial context when making staffing decisions.
Query Interface Design
Rather than forcing non-technical stakeholders to write QUERY formulas, I created pre-built analytical views that automatically surfaced insights. Leadership could simply navigate between sheets to find answers like:
- "Which team members have mastered accessibility but aren't interested in research?"
- "What's our team's overall capacity for usability testing projects?"
- "How do these three potential team configurations compare for a complex research project?"
Results & Impact
Organizational Insights Uncovered
Hidden Technical Capabilities
The assessment revealed that several team members had stronger development backgrounds than leadership realized, opening up new possibilities for technical UX work and cross-functional collaboration.
Strategic Decision Support
Assessment results informed Nielsen Norman Group course selections for the team, demonstrating how individual skill gaps could drive organizational learning investments.
System Evolution & Stakeholder Response
Iterative Development: The system evolved based on stakeholder feedback, with leadership requesting additional views like the project-specific skills analysis that allowed custom skill combinations beyond traditional role definitions.
Autonomous Usage: Leadership operated the system independently, demonstrating the success of creating accessible analytical tools for non-technical stakeholders.
Challenges & Solutions
System Lifecycle & Transition
Challenge: Maintaining data currency as team members' skills evolved and project priorities shifted
Solution: Implemented bi-annual assessment cycles with archived historical data, though system eventually became outdated when I transitioned to different projects
Creating Self-Service Analytics
Challenge: Enabling non-technical leadership to perform complex team analysis independently
Solution: Built intuitive sheet-based interfaces that abstracted QUERY complexity behind user-friendly views
What I'd Do Differently
Enhanced System Design
- Automated Data Refresh: Implement more sustainable data maintenance processes, possibly integrating with HR systems rather than relying on manual bi-annual surveys
- Dual Assessment Framework: Build a system where both employees and managers complete assessments, then use the comparison view to facilitate career development conversations around discrepancies
- Enhanced Validation: Consider peer validation for critical skills or implement calibration exercises to help team members understand skill level definitions more consistently
Career Development Integration
Unrealized Potential: We could have used this for career progression conversations where both you and your manager assessed you, then used the comparison view to come together and discuss any differences—but I never built this feature.
Personal Learning Outcomes
Small-Scale Iteration Impact
This project taught me the critical importance of testing changes at small scale where you can clearly observe their impact. With 21 engaged team members, we could immediately see how system adjustments affected behavior—insights I've applied to enterprise design system work where testing component changes requires similar careful observation.
Domain Transfer Potential
This project demonstrated that analytical skills developed in personal contexts (gaming statistics) can solve complex organizational problems. The key is recognizing underlying data structure similarities across seemingly unrelated domains.
Self-Service Tool Design
Creating systems that stakeholders can operate independently requires balancing analytical power with interface simplicity—a lesson I've applied to subsequent design system documentation and component specification work.